MarketInOut Stock Screener Please enable JavaScript to view this page content properly Log In | Sign Up
 
Overbought/Oversold
OVERBOUGHT/OVERSOLD

Overview

The Overbought/Oversold ("OB/OS") indicator is a market breadth indicator based on the smoothed difference between advancing and declining issues.


Interpretation

The OB/OS indicator shows when the stock market is overbought (and a correction is due) and when it is oversold (and a rally is due).

Readings above +200 are generally considered bearish and readings below -200 are generally considered bullish. When the OB/OS indicator falls below +200 a sell signal is generated. Similarly, a buy signal is generated when the OB/OS indicator rises above -200.

As with all OB/OS-type indicators, extreme readings may be a sign of a change in investor expectations and may not be followed by the expected correction. (Refer to the discussion on the Advance/Decline Ratio, and the McClellan Oscillator, for additional comments on extremely overbought/oversold conditions.)


Example

The following chart shows the DJIA and the Overbought/Oversold indicator.
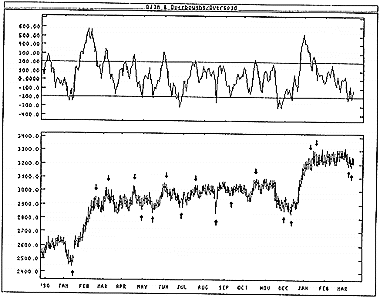
I drew "buy" and "sell" arrows when the indicator penetrated the +200/-200 levels. The OB/OS indicator works very well in this type of trading-range market.


Calculation

The Overbought/Oversold indicator is a 10-period exponential moving average of the difference between the number of advancing and declining issues.


RSI Stock Screener Action
 RSI(14) Bullish Divergence   Customize Screen   Backtest Screen   Trade Alert  
 RSI(14) Crossed Above 70   Customize Screen   Backtest Screen   Trade Alert  
 RSI(14) Crossed Above 50   Customize Screen   Backtest Screen   Trade Alert  
 RSI(14) Crossed Above 30   Customize Screen   Backtest Screen   Trade Alert  
 RSI(14) Trending Up Last 3 Days   Customize Screen   Backtest Screen   Trade Alert  
 RSI(14) Trending Up Last 7 Days   Customize Screen   Backtest Screen   Trade Alert  
 RSI(14) Trending Up Last 13 Days   Customize Screen   Backtest Screen   Trade Alert  
 RSI(14) Trending Up Last 26 Days   Customize Screen   Backtest Screen   Trade Alert  
 RSI(14) Between 70 and 100   Customize Screen   Backtest Screen   Trade Alert  
 RSI(14) Between 50 and 70   Customize Screen   Backtest Screen   Trade Alert  
 RSI(14) Between 30 and 50   Customize Screen   Backtest Screen   Trade Alert  
 RSI(14) Between 0 and 30   Customize Screen   Backtest Screen   Trade Alert  
 RSI(14) Trending Down Last 26 Days   Customize Screen   Backtest Screen   Trade Alert  
 RSI(14) Trending Down Last 13 Days   Customize Screen   Backtest Screen   Trade Alert  
 RSI(14) Trending Down Last 7 Days   Customize Screen   Backtest Screen   Trade Alert  
 RSI(14) Trending Down Last 3 Days   Customize Screen   Backtest Screen   Trade Alert  
 RSI(14) Crossed Below 30   Customize Screen   Backtest Screen   Trade Alert  
 RSI(14) Crossed Below 50   Customize Screen   Backtest Screen   Trade Alert  
 RSI(14) Crossed Below 70   Customize Screen   Backtest Screen   Trade Alert  
 RSI(14) Bearish Divergence   Customize Screen   Backtest Screen   Trade Alert  


Disclaimer - Privacy Policy - Cookie Use Policy - FAQ - Contact Us
Copyright ©2008-2024 MarketInOut.com. All rights reserved.